



Menu traffic, peak hours and reservations in one dashboard — plus sales and best sellers when you use QR Order.
Mezivo Reporting shows how often your QR menu is opened, when your peak hours fall and how reservations are trending — and, if you use QR Order, what is selling — in one dashboard, so a restaurant, café or hotel always has one clear picture of how the business is actually running.
Instead of piecing numbers together from separate tools at the end of the week, staff and management look at the same figures. The dashboard refreshes every time it is opened and can be reloaded with one tap, so a problem, or a trend worth acting on, can be caught while there is still time to do something about it.
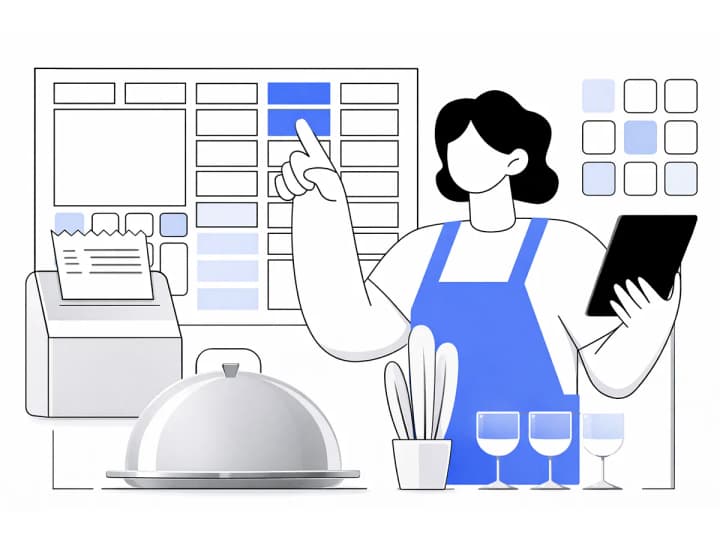
Every QR Menu scan is recorded: how many times your menu was opened today, this week and this month, how many different guests looked at it, which of your menus gets the most attention and which table guests scanned from. The languages and devices your guests use are on the same screen.
Product-level sales come from QR Order. Orders guests place flow into order analytics, where best sellers are ranked by quantity or by revenue and sales are broken down by day and by hour. Change a price or start a campaign, and you can watch its effect in those numbers instead of guessing at it.

Traffic never lands evenly across a service, and the dashboard shows where it clusters — which hours the menu is scanned, which days of the week run busiest, and when guests with a reservation usually arrive. Patterns that used to live in a manager's memory become numbers anyone on the team can check.
That makes staffing and prep decisions less of a guess: knowing Friday's 8 p.m. rush reliably outpaces Tuesday's is worth more the earlier it's known, not after the fact.
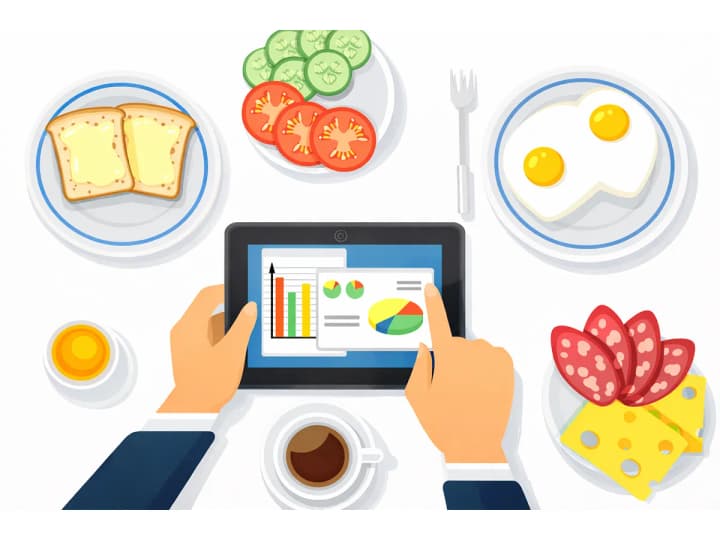
The overview screen is what the floor manager checks mid-shift and what ownership reviews at the end of the month: today's menu scans, today's and tomorrow's reservations, occupancy, the no-show rate and, with QR Order switched on, today's orders, side by side. Data from Mezivo Reservation sits in the same dashboard rather than in a separate system.
Because booking volume is always compared with the previous period, a single busy night is easy to tell apart from a real trend — occupancy climbing over a month means something different than occupancy climbing for one holiday weekend, and the dashboard makes that distinction visible.

None of this replaces judgment — it gives it something to work from. Early signs of the menu being opened less often, bookings bunching on certain days or, with QR Order, an item no longer selling as it did show up in the numbers before they show up in a bad review or a slow month.
The result is a business run on what actually happened last week, not on what it felt like.
Mezivo - Reporting
Every number, one dashboard
See menu traffic, peak hours and reservations — and, with QR Order, sales — in one dashboard, and run the business on real data.